Theories
Explore the data sets starting with Gator Goods then follow Flock Feed comments over several days. Finally, try a map chart to track the Flock Plot data.
For chart ideas, check out these sample charts or browse the chart gallery for additional chart ideas.


Custom Color & Shape Legend (Yellow Diamond), Figure 13.23

Packed Bubbles, Figure 7.27

Donut Chart, Figure 6.22

Density Mark, Figure 7.62

Area Chart, Click Data Points to Sort with a Set, Figure 8.44

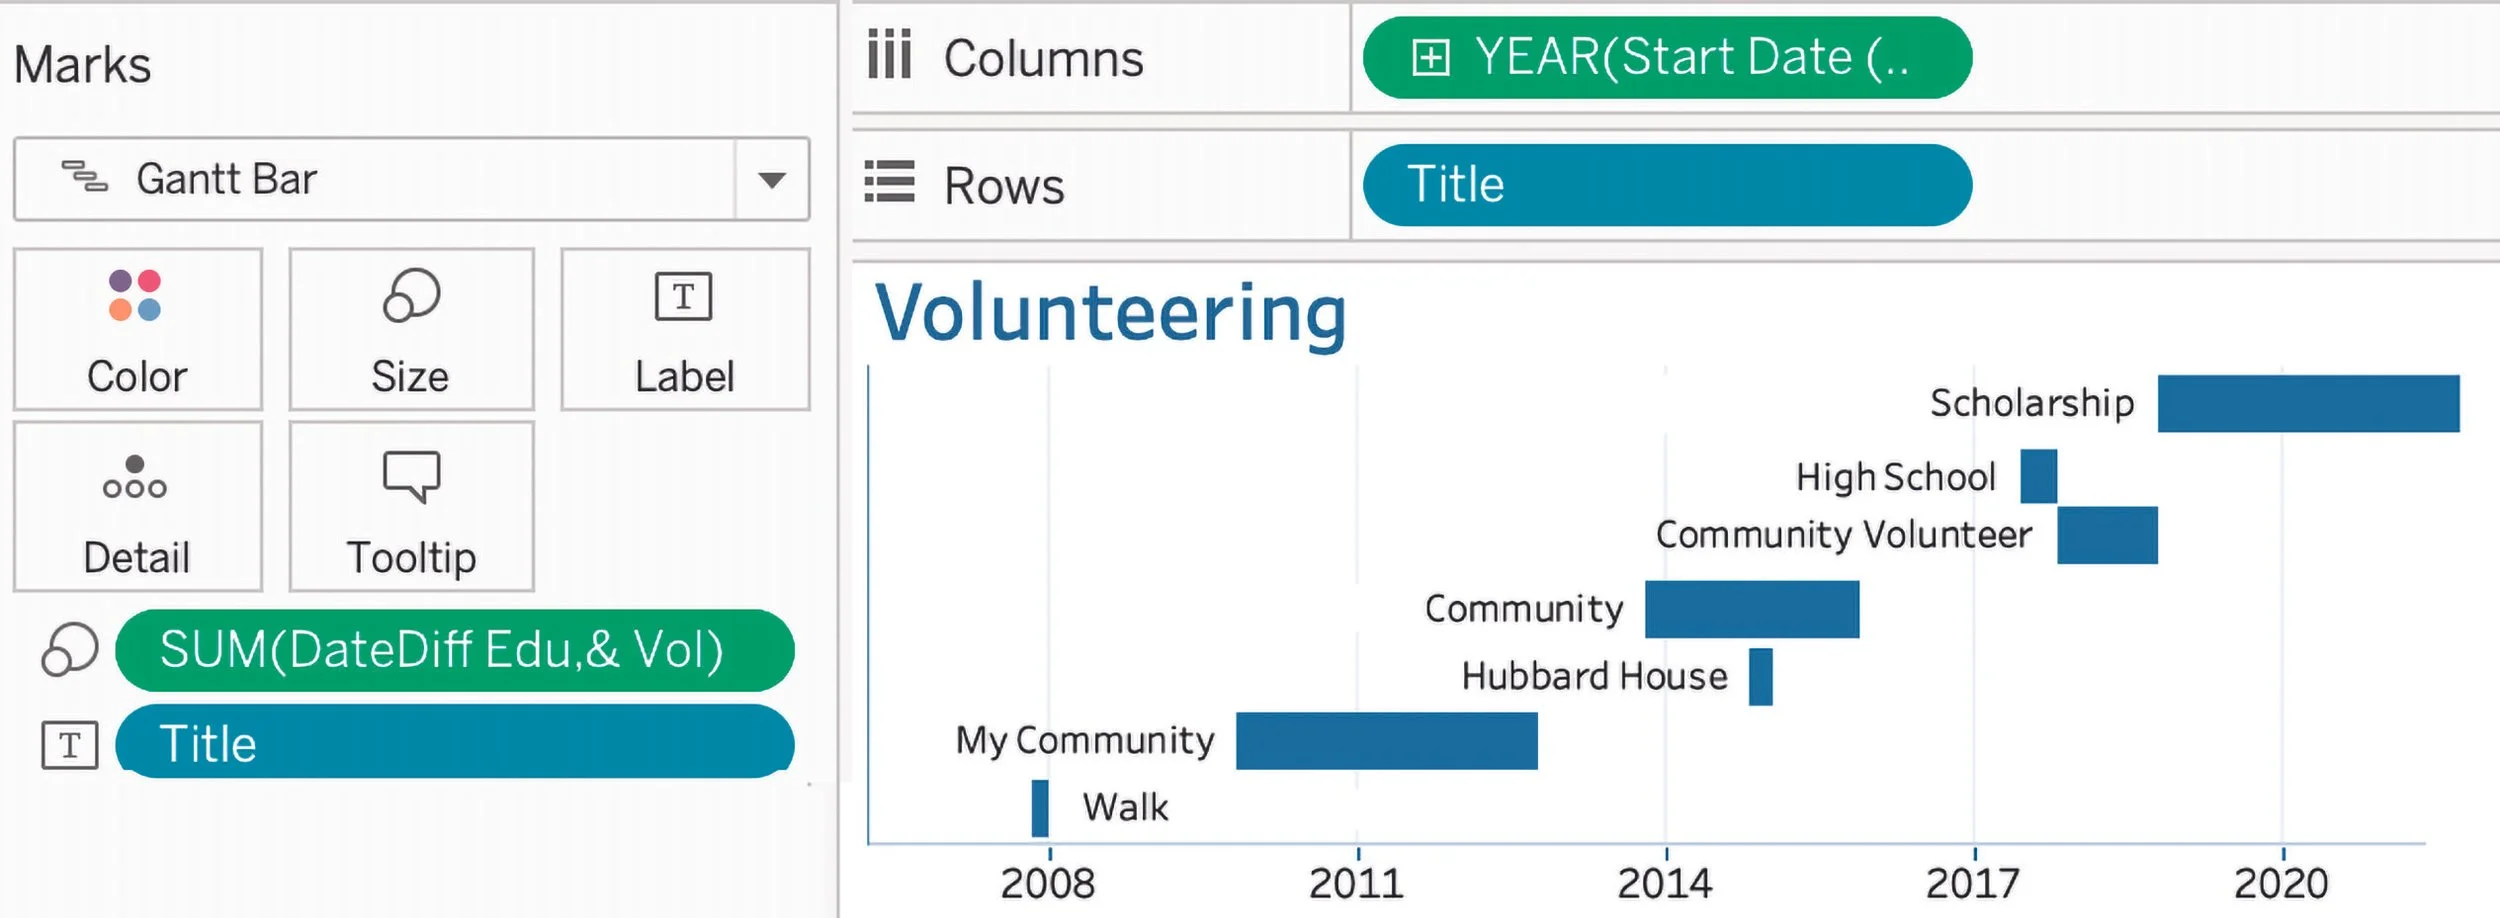
Gantt Bar Marks, Figure 7.39
Time Duration for Gantt Bar, Waterfall & Resume, Figure 9.29

Maps, Halo, Figure 7.70

Timeline Chart - Shape Marks, Figure 7.49