Chart Gallery:
Browse the images below showcasing the step-by-step examples from the book Tableau at Work.
Click to download a specific image.

Call Attention to the Difference with Color, Figure 7.81

Custom Color & Shape Legend (Yellow Diamond), Figure 13.23

Packed Bubbles, Figure 7.27
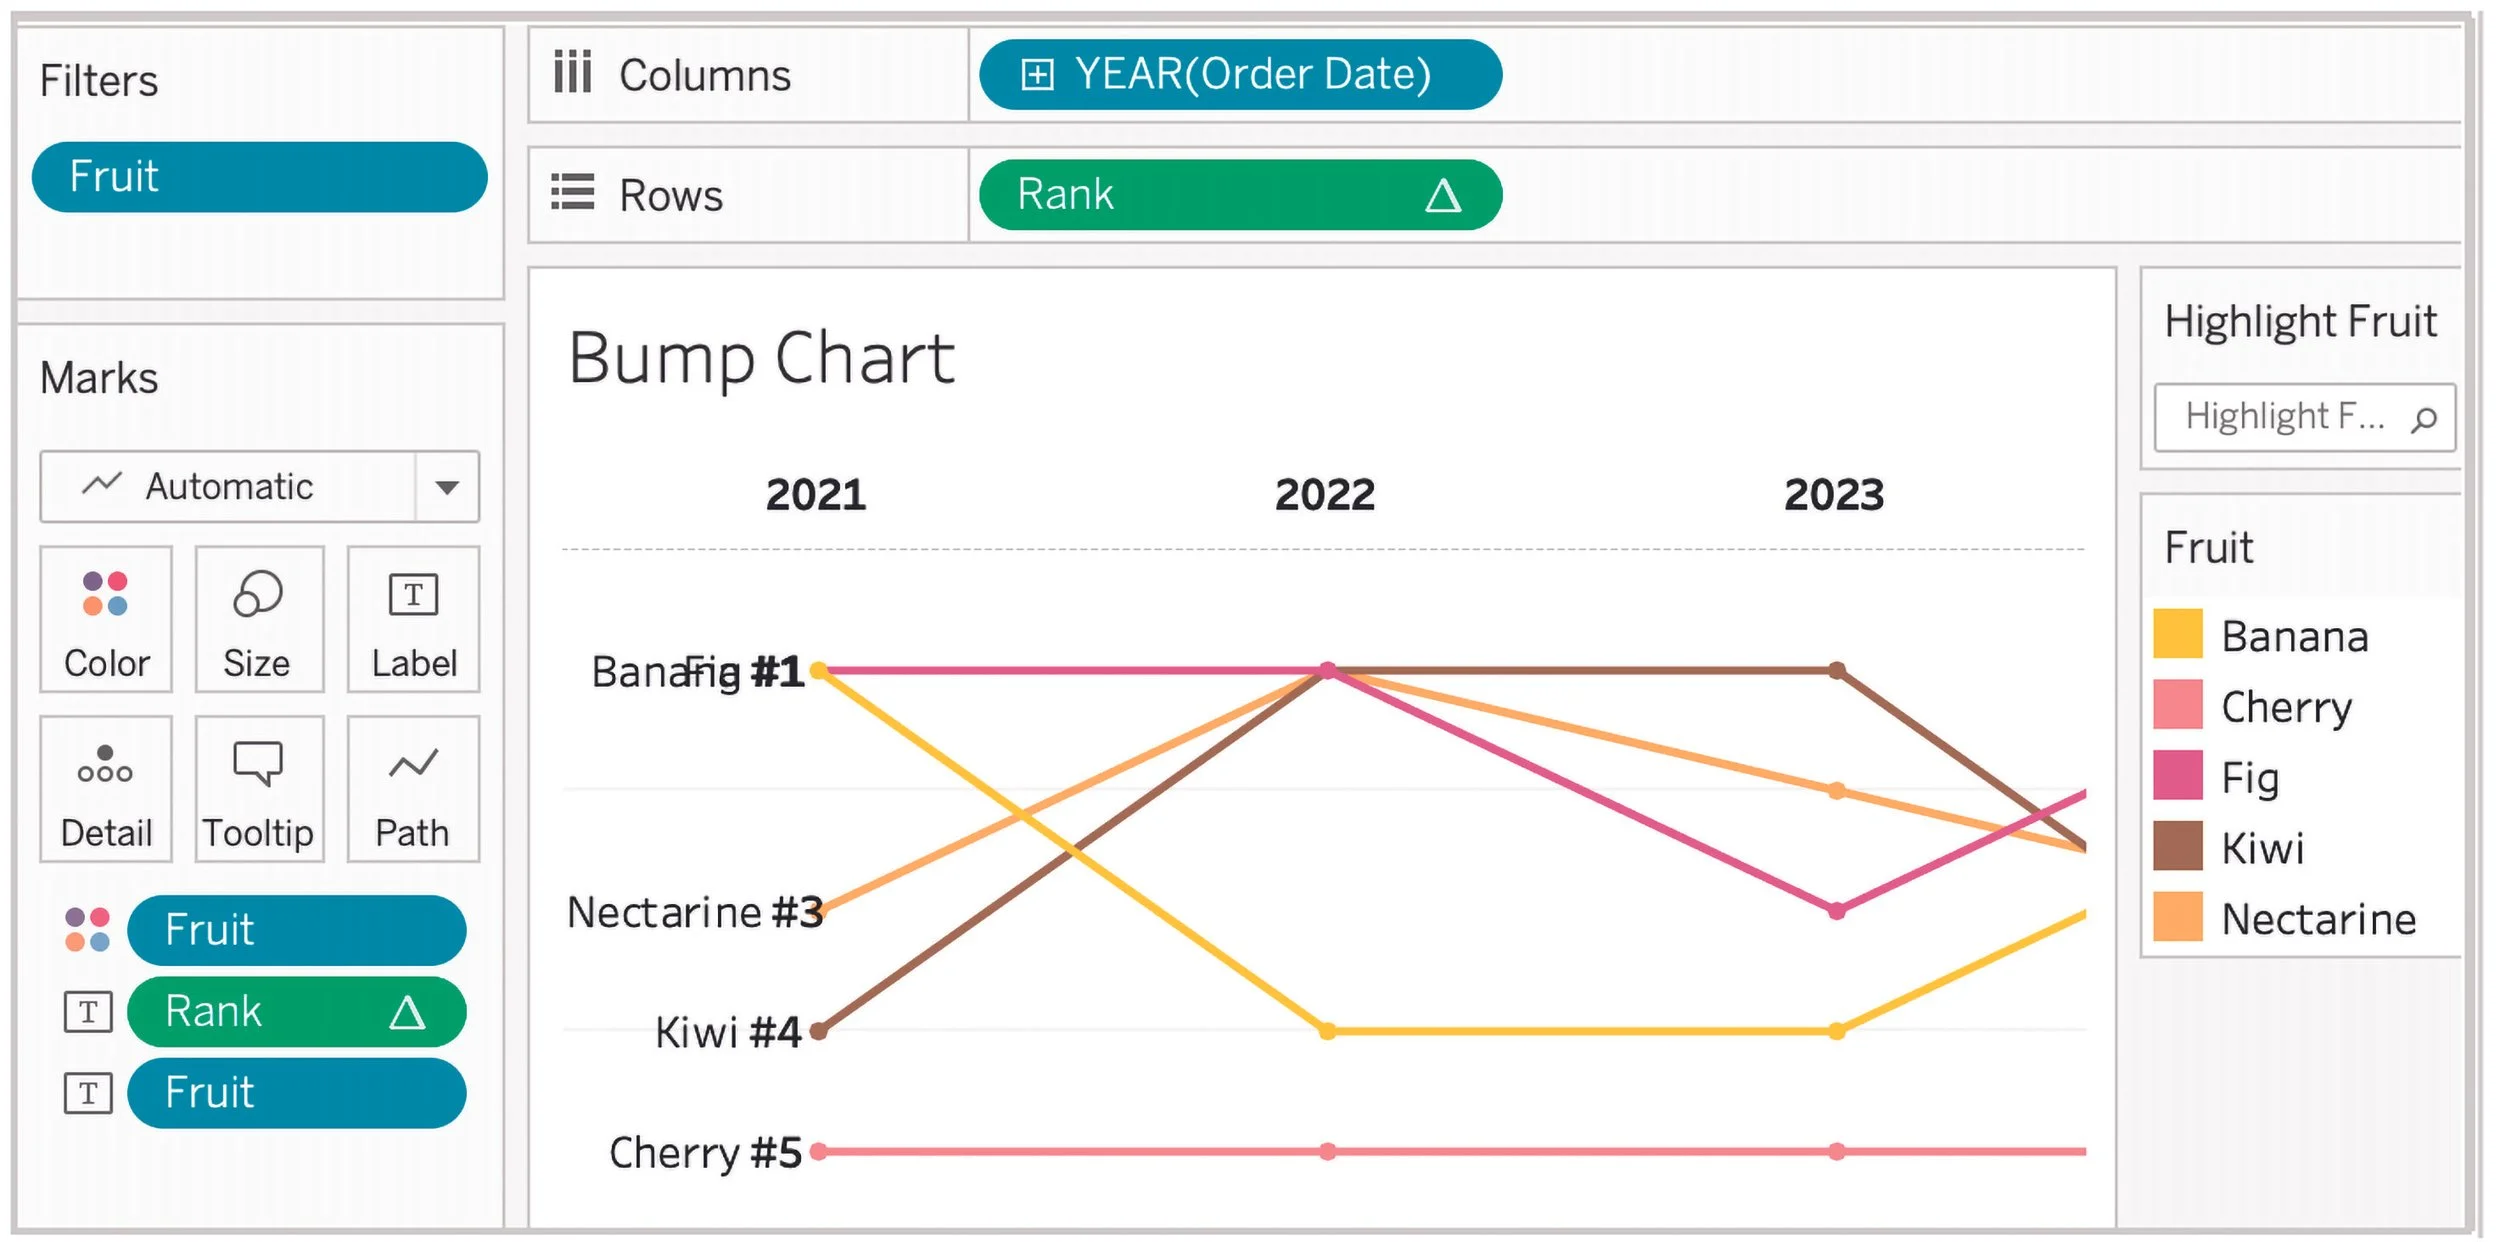
Bump Chart, Figure 10.22

Bullet Graph with Reference Line and Distribution Band, Figure 7.104

Box and Whisker, Figure 7.36

Donut Chart, Figure 6.22

Density Mark, Figure 7.62

Color Property, Highlight Table, Figure 7.73

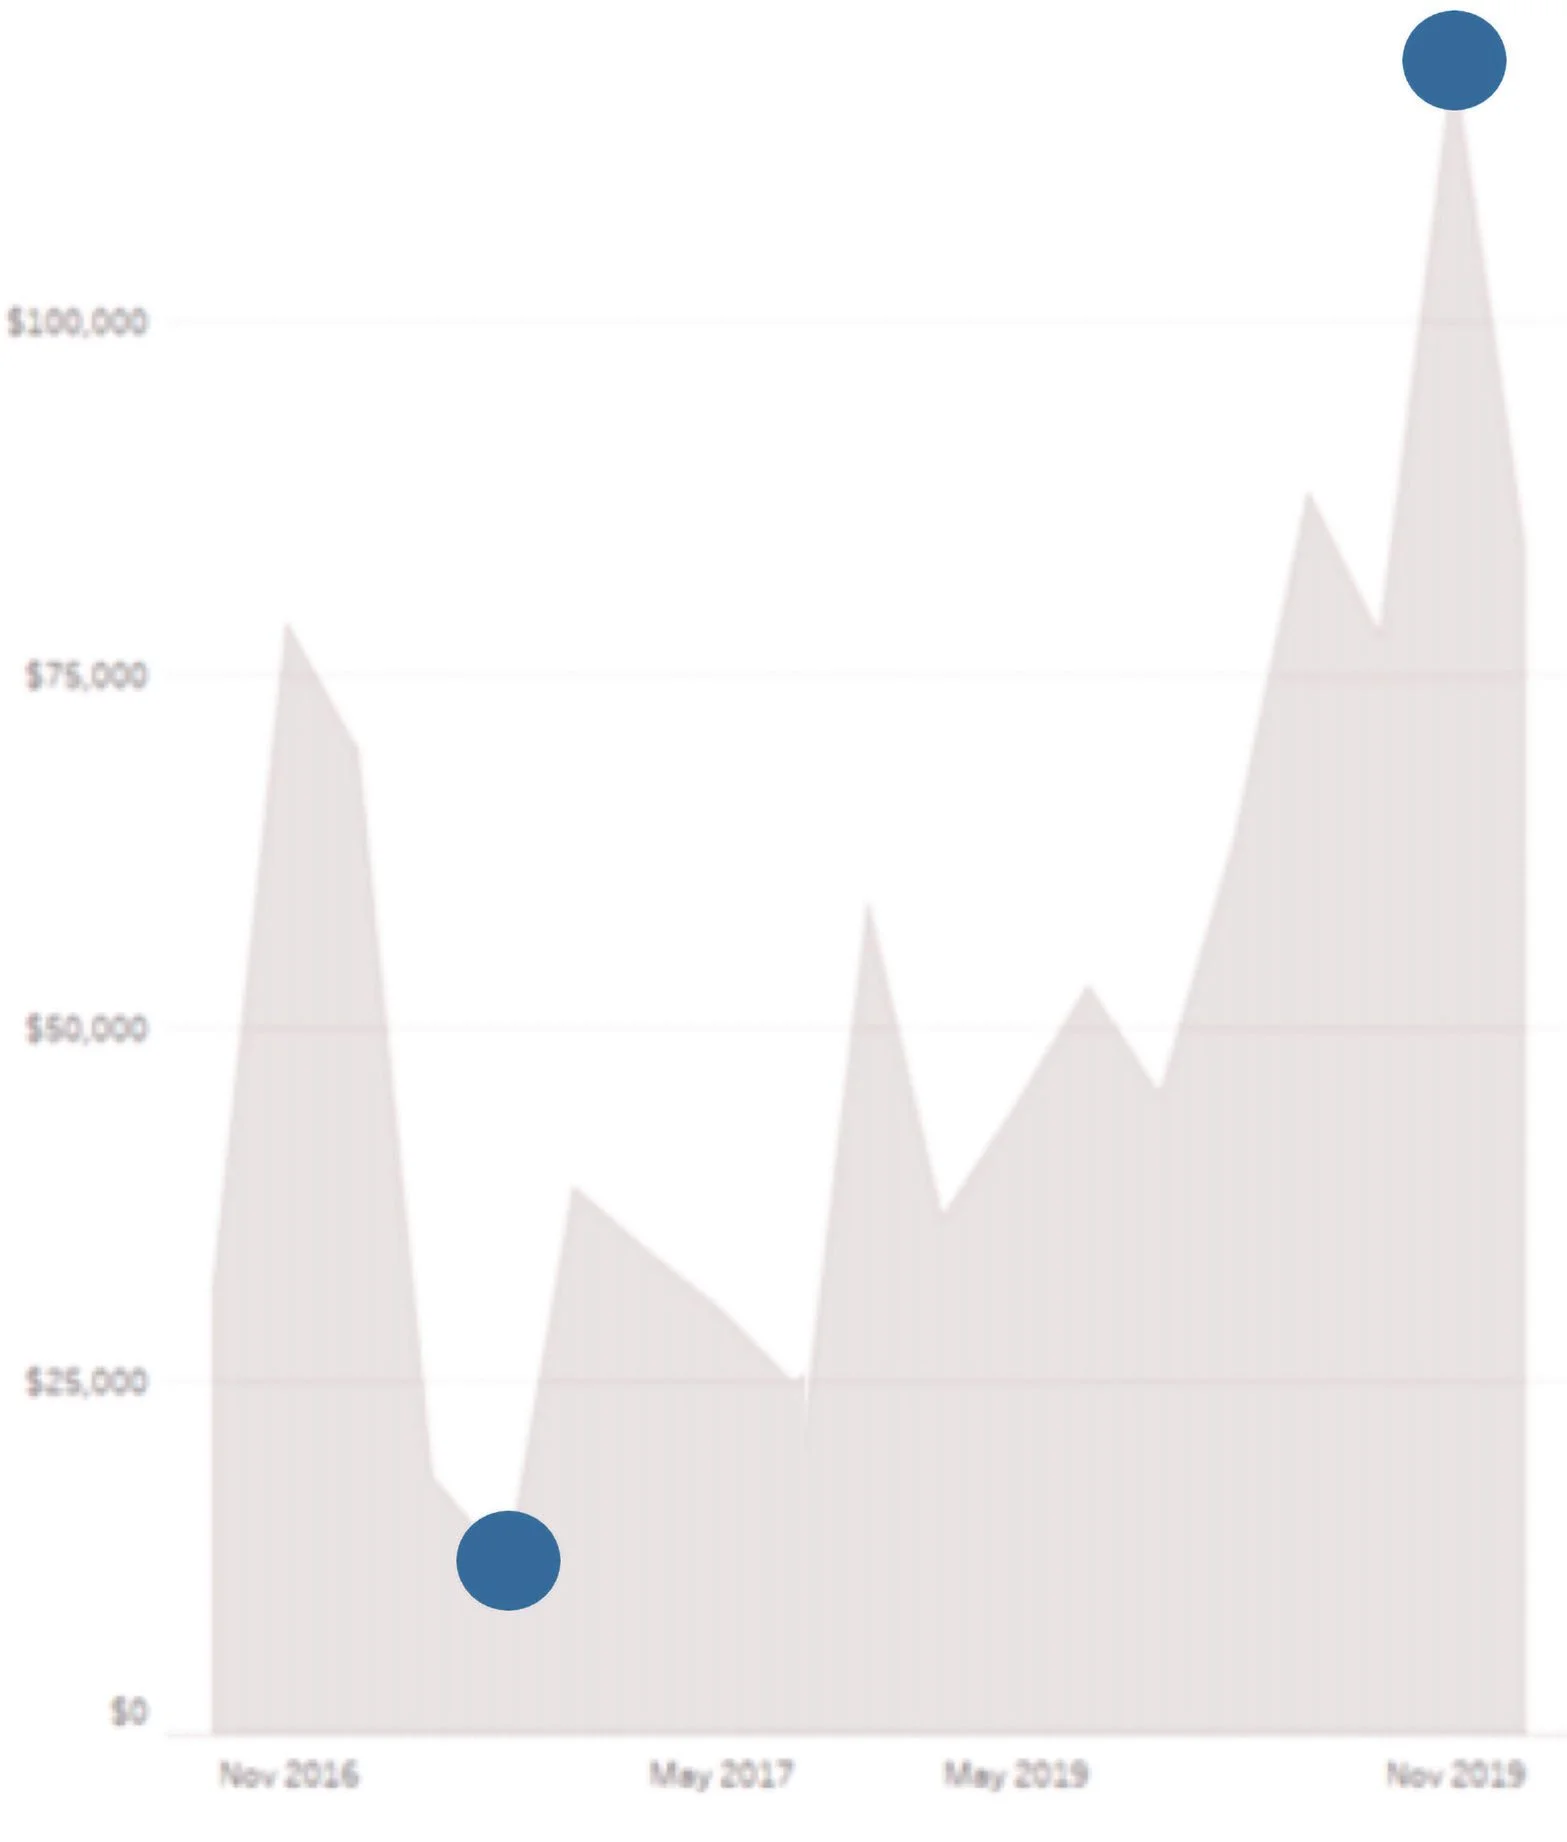
Area Chart, Click Data Points to Sort with a Set, Figure 8.44

Pareto Chart, Figure 10,9

Annotations, Annotate the Area Chart, Figure 13.30

Match Label Colors to Bar Labels, Figure 7.76

Hover to Choose a Field for Sorting, Figure 8.55

Multiple Panes in One View, Figure 6.11

Fixed LOD Example, Figure 11.39

Dual Axes Area & Line, Figure 6.8

Opacity, Figure 7.77

Drill Down with a Set Action, Figure 15.19
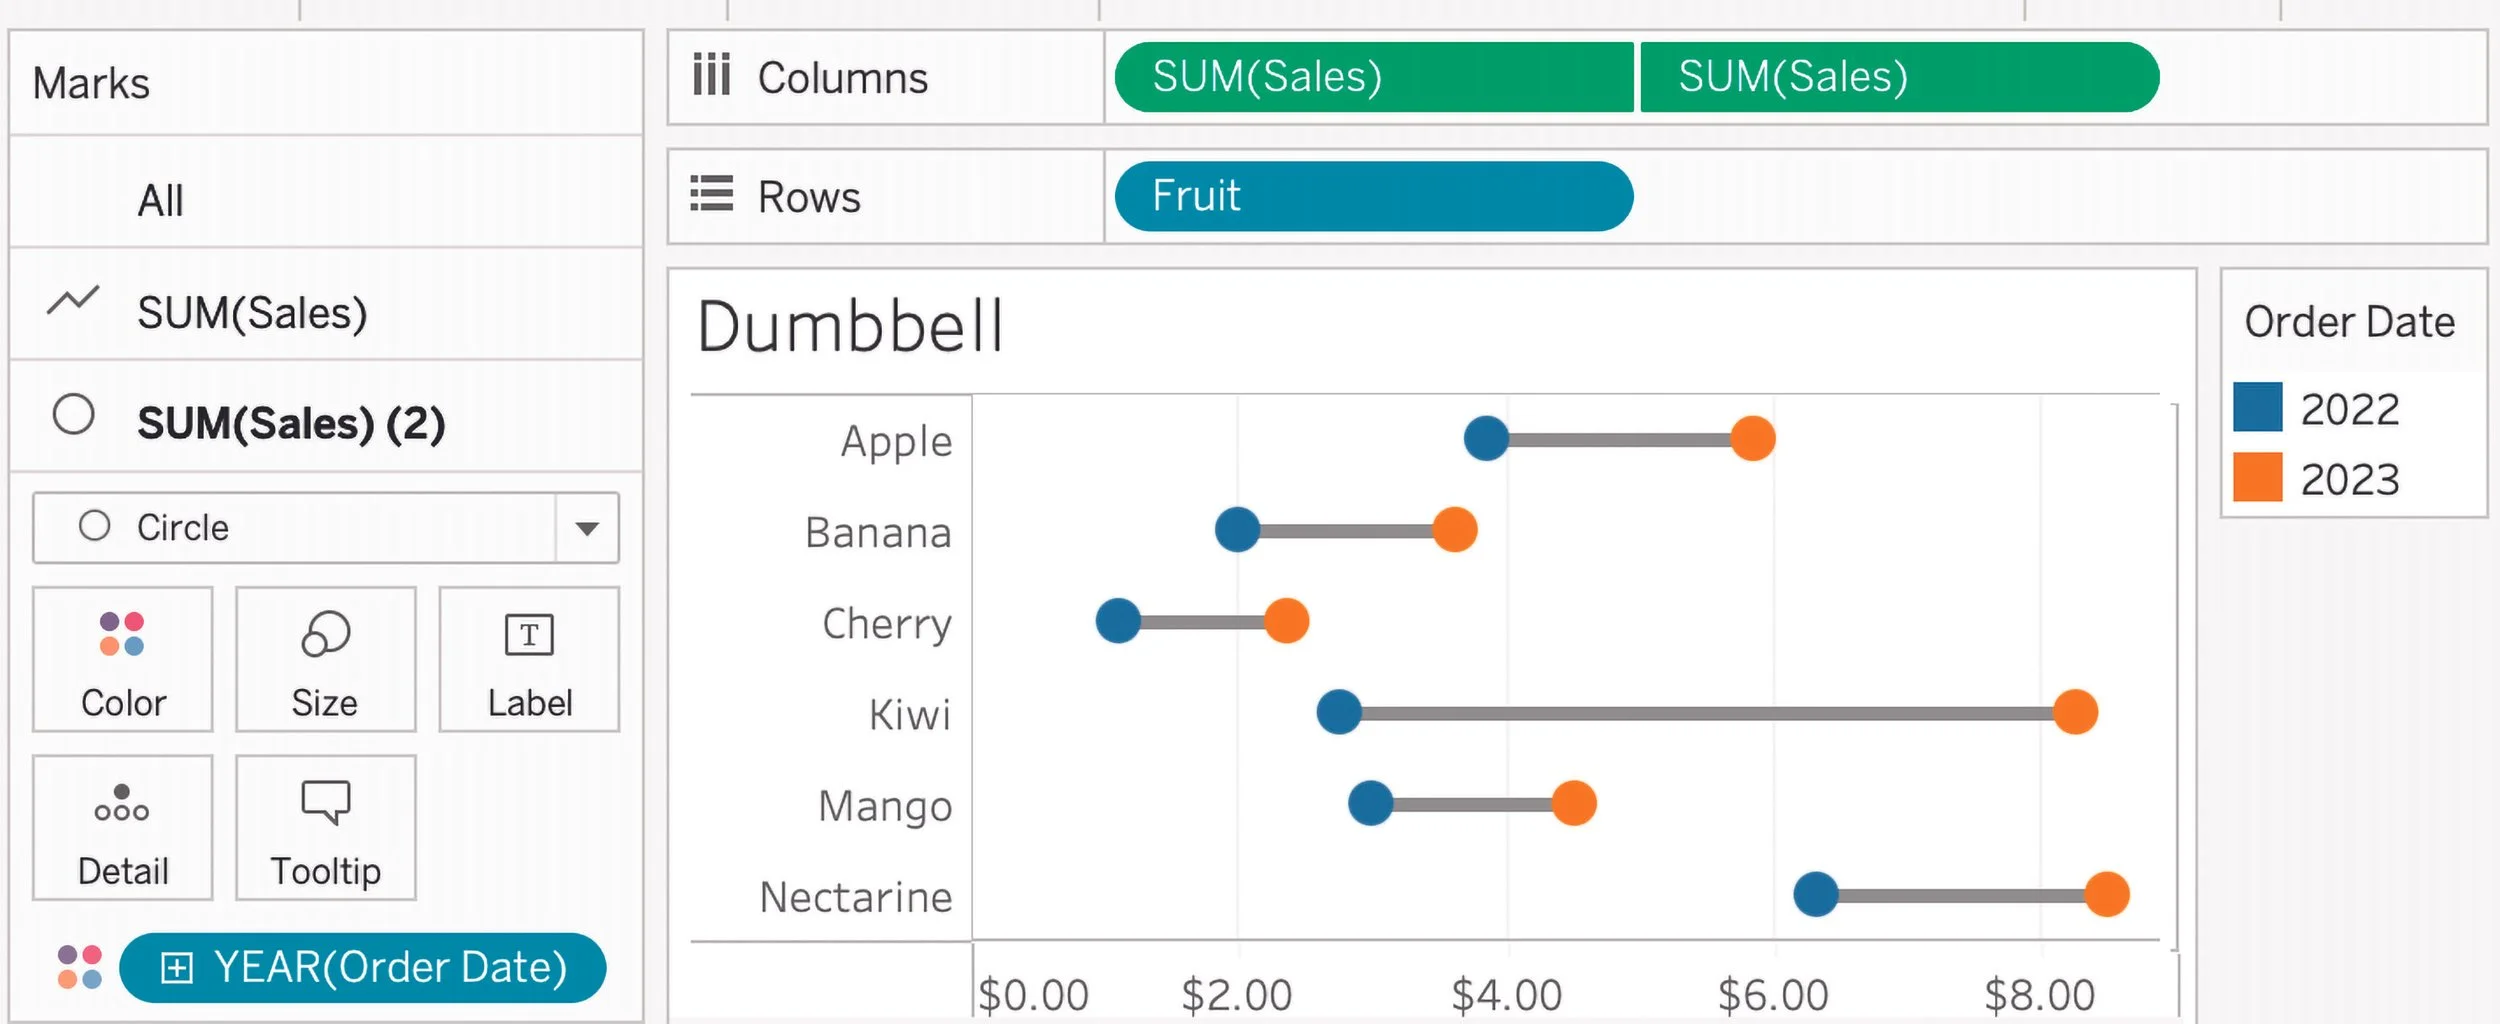
Dumbbell Chart, Figure 7.61

A Resume Combine a Waterfall Chart, Time Duration, & Gantt Barr, Figure 9.31

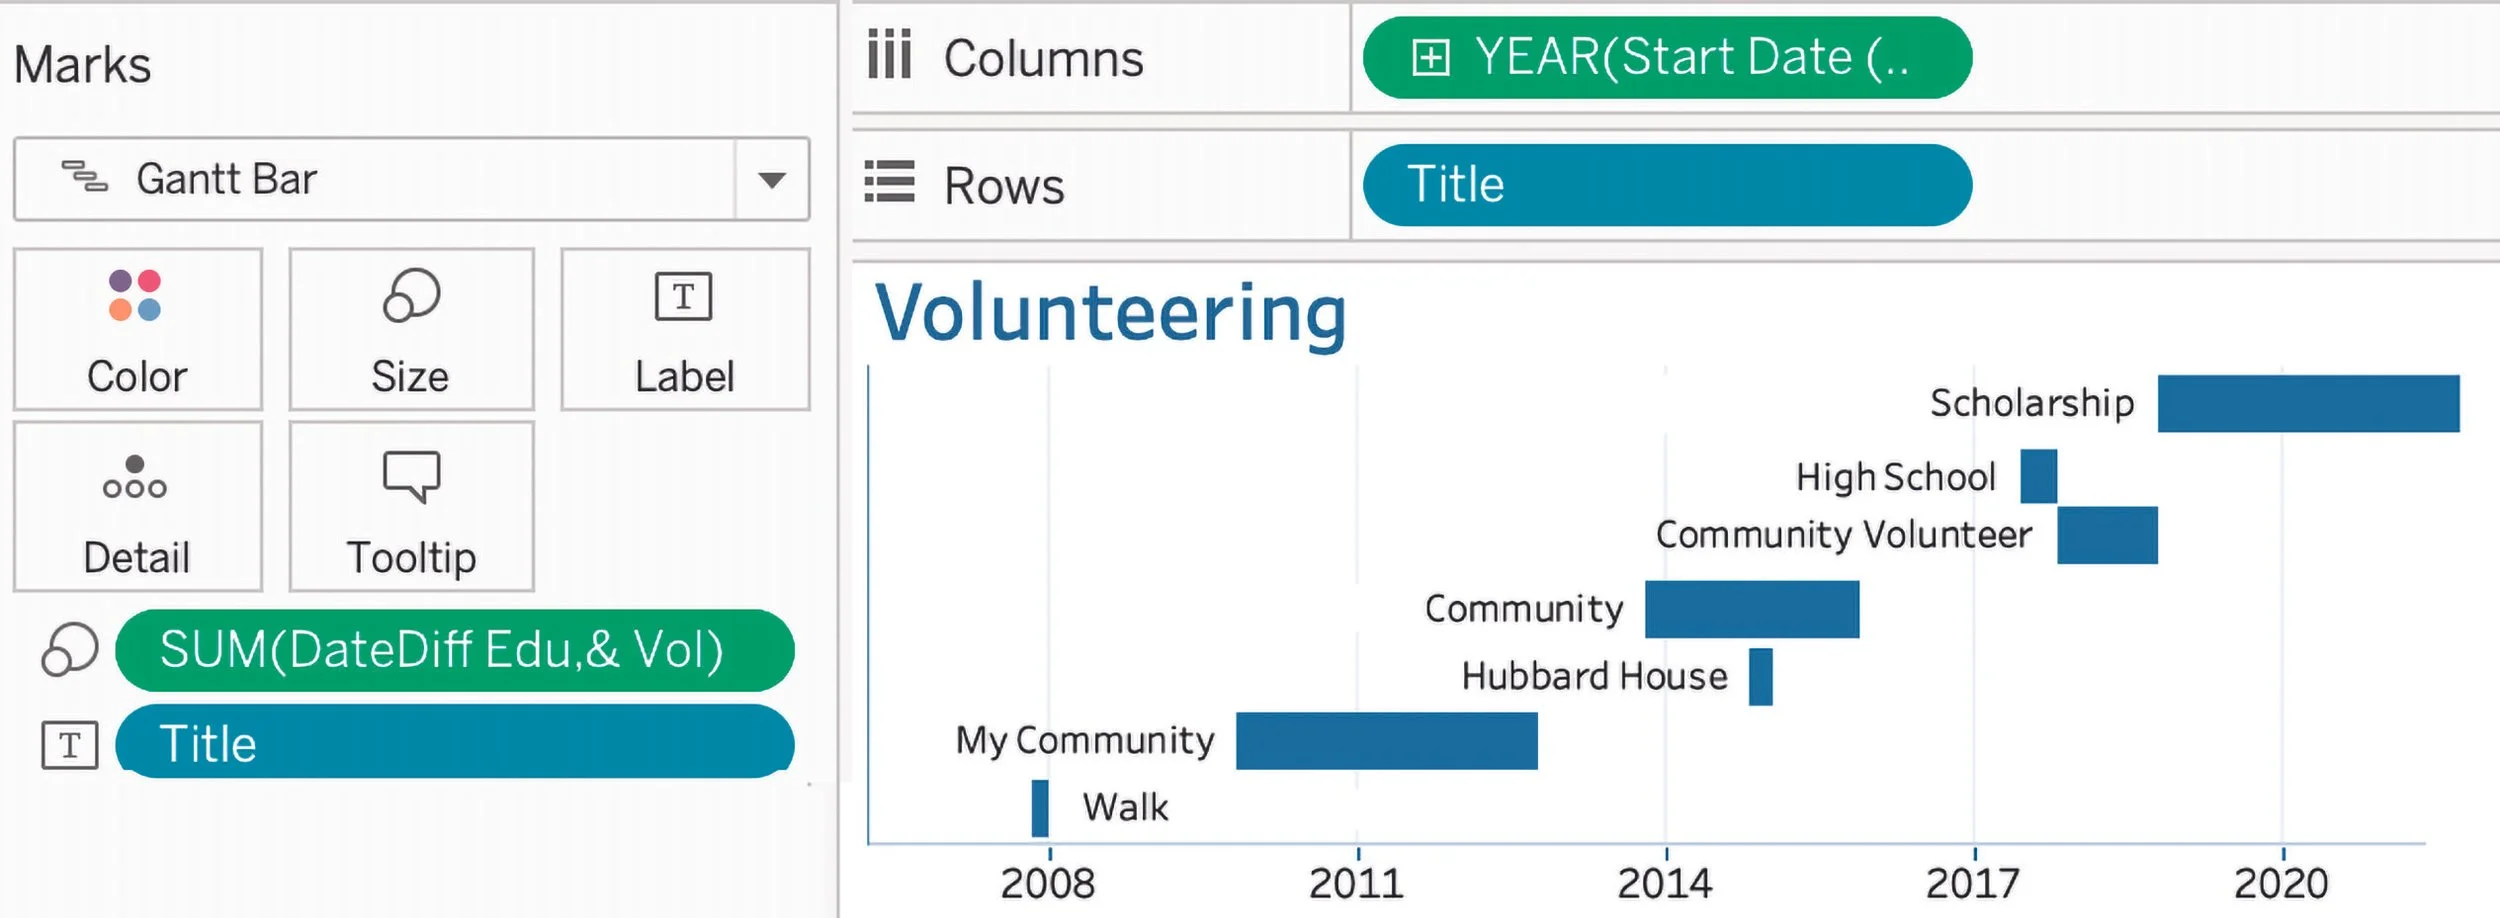
Gantt Bar Marks, Figure 7.39
Time Duration for Gantt Bar, Waterfall & Resume, Figure 9.29

Sorting Segments Within a Stacked Bar, Figure 8.70

Histogram, Figure 7.24

KPIs and BANs, Figure 14.97
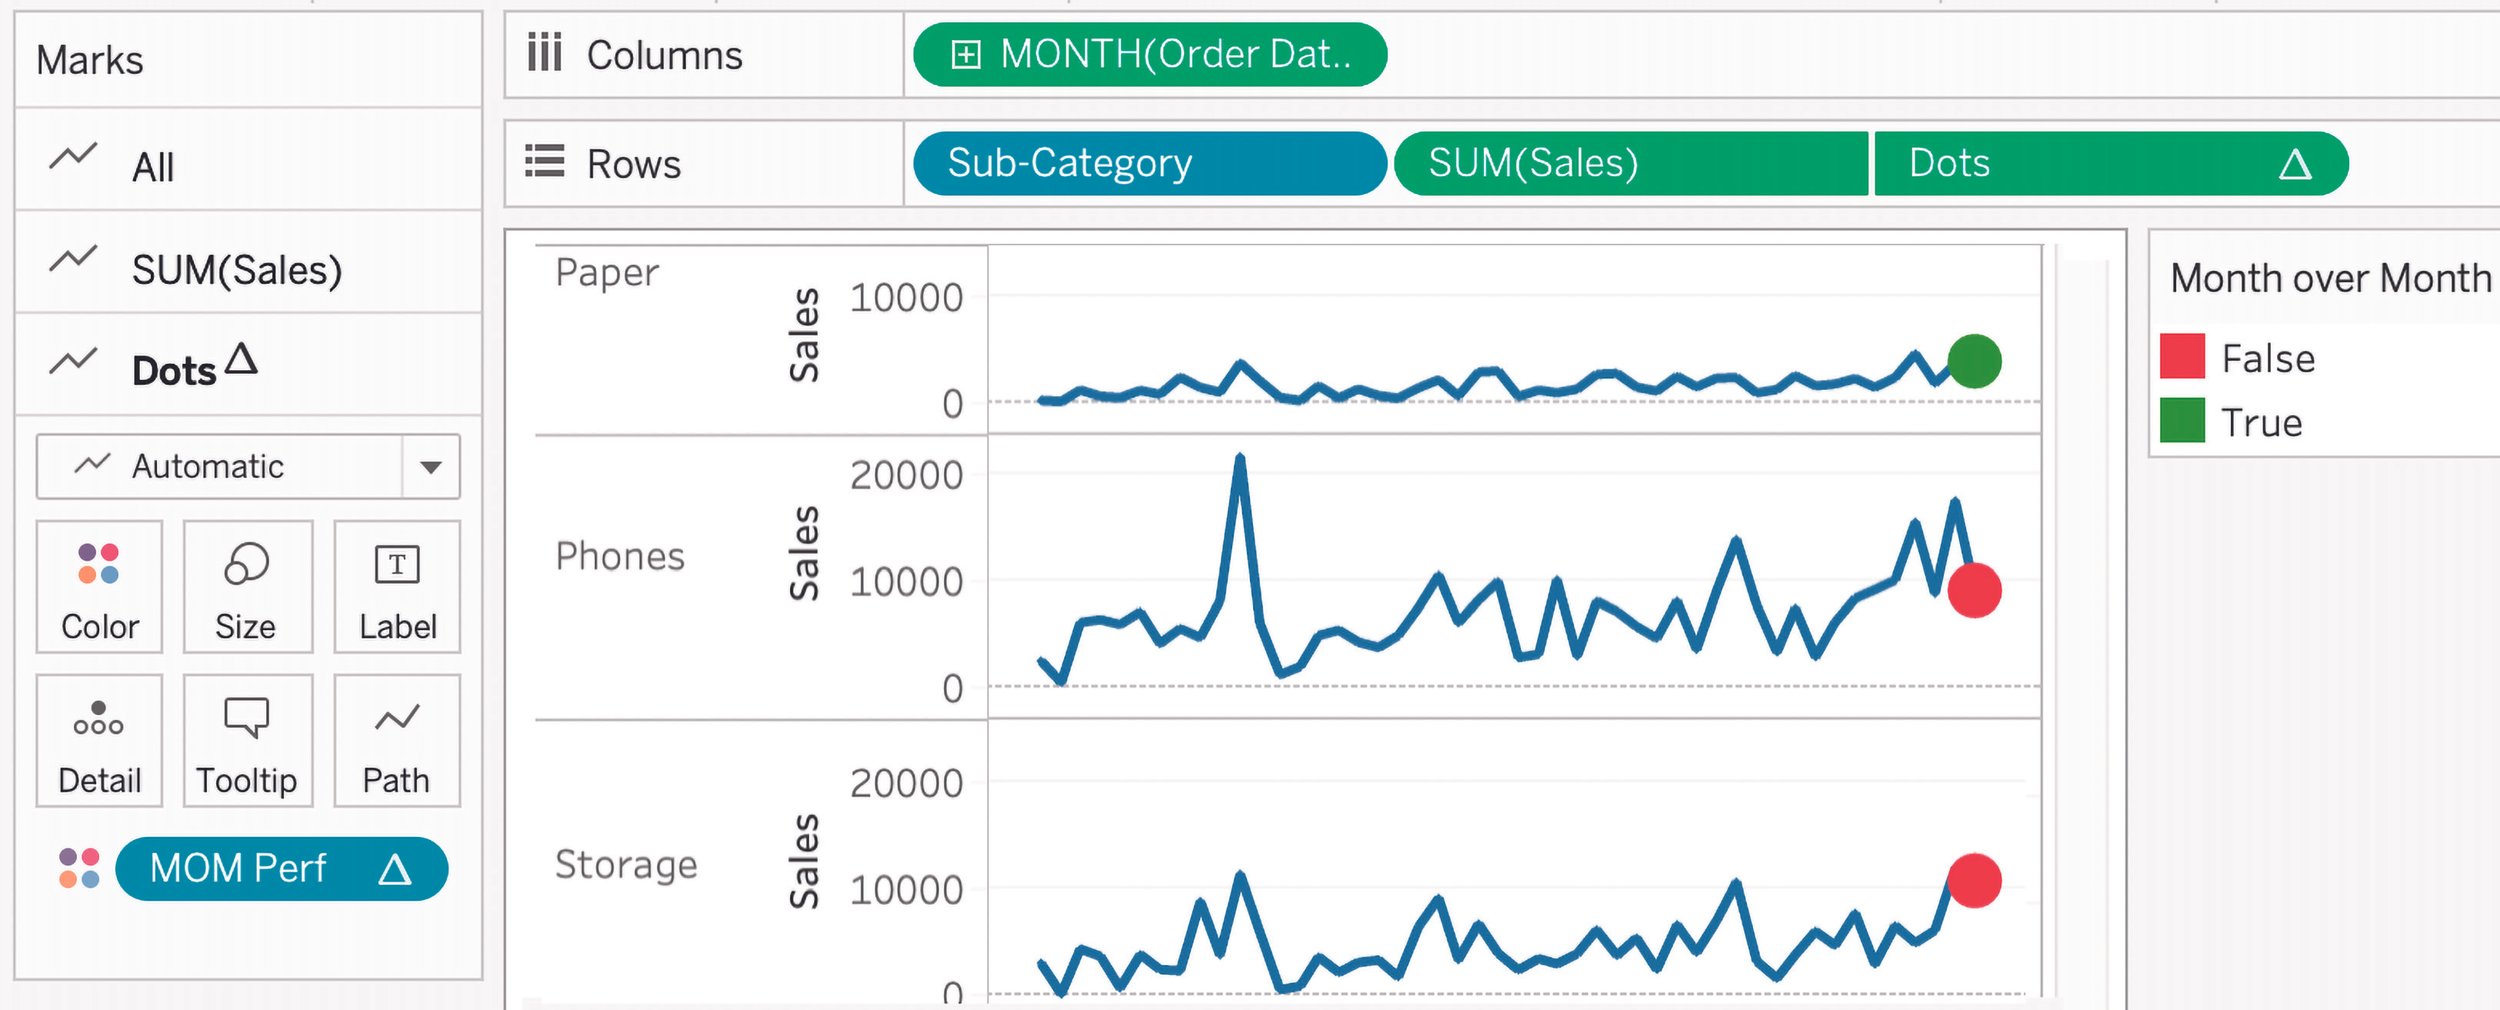
Spark Lines, Figure 7.30
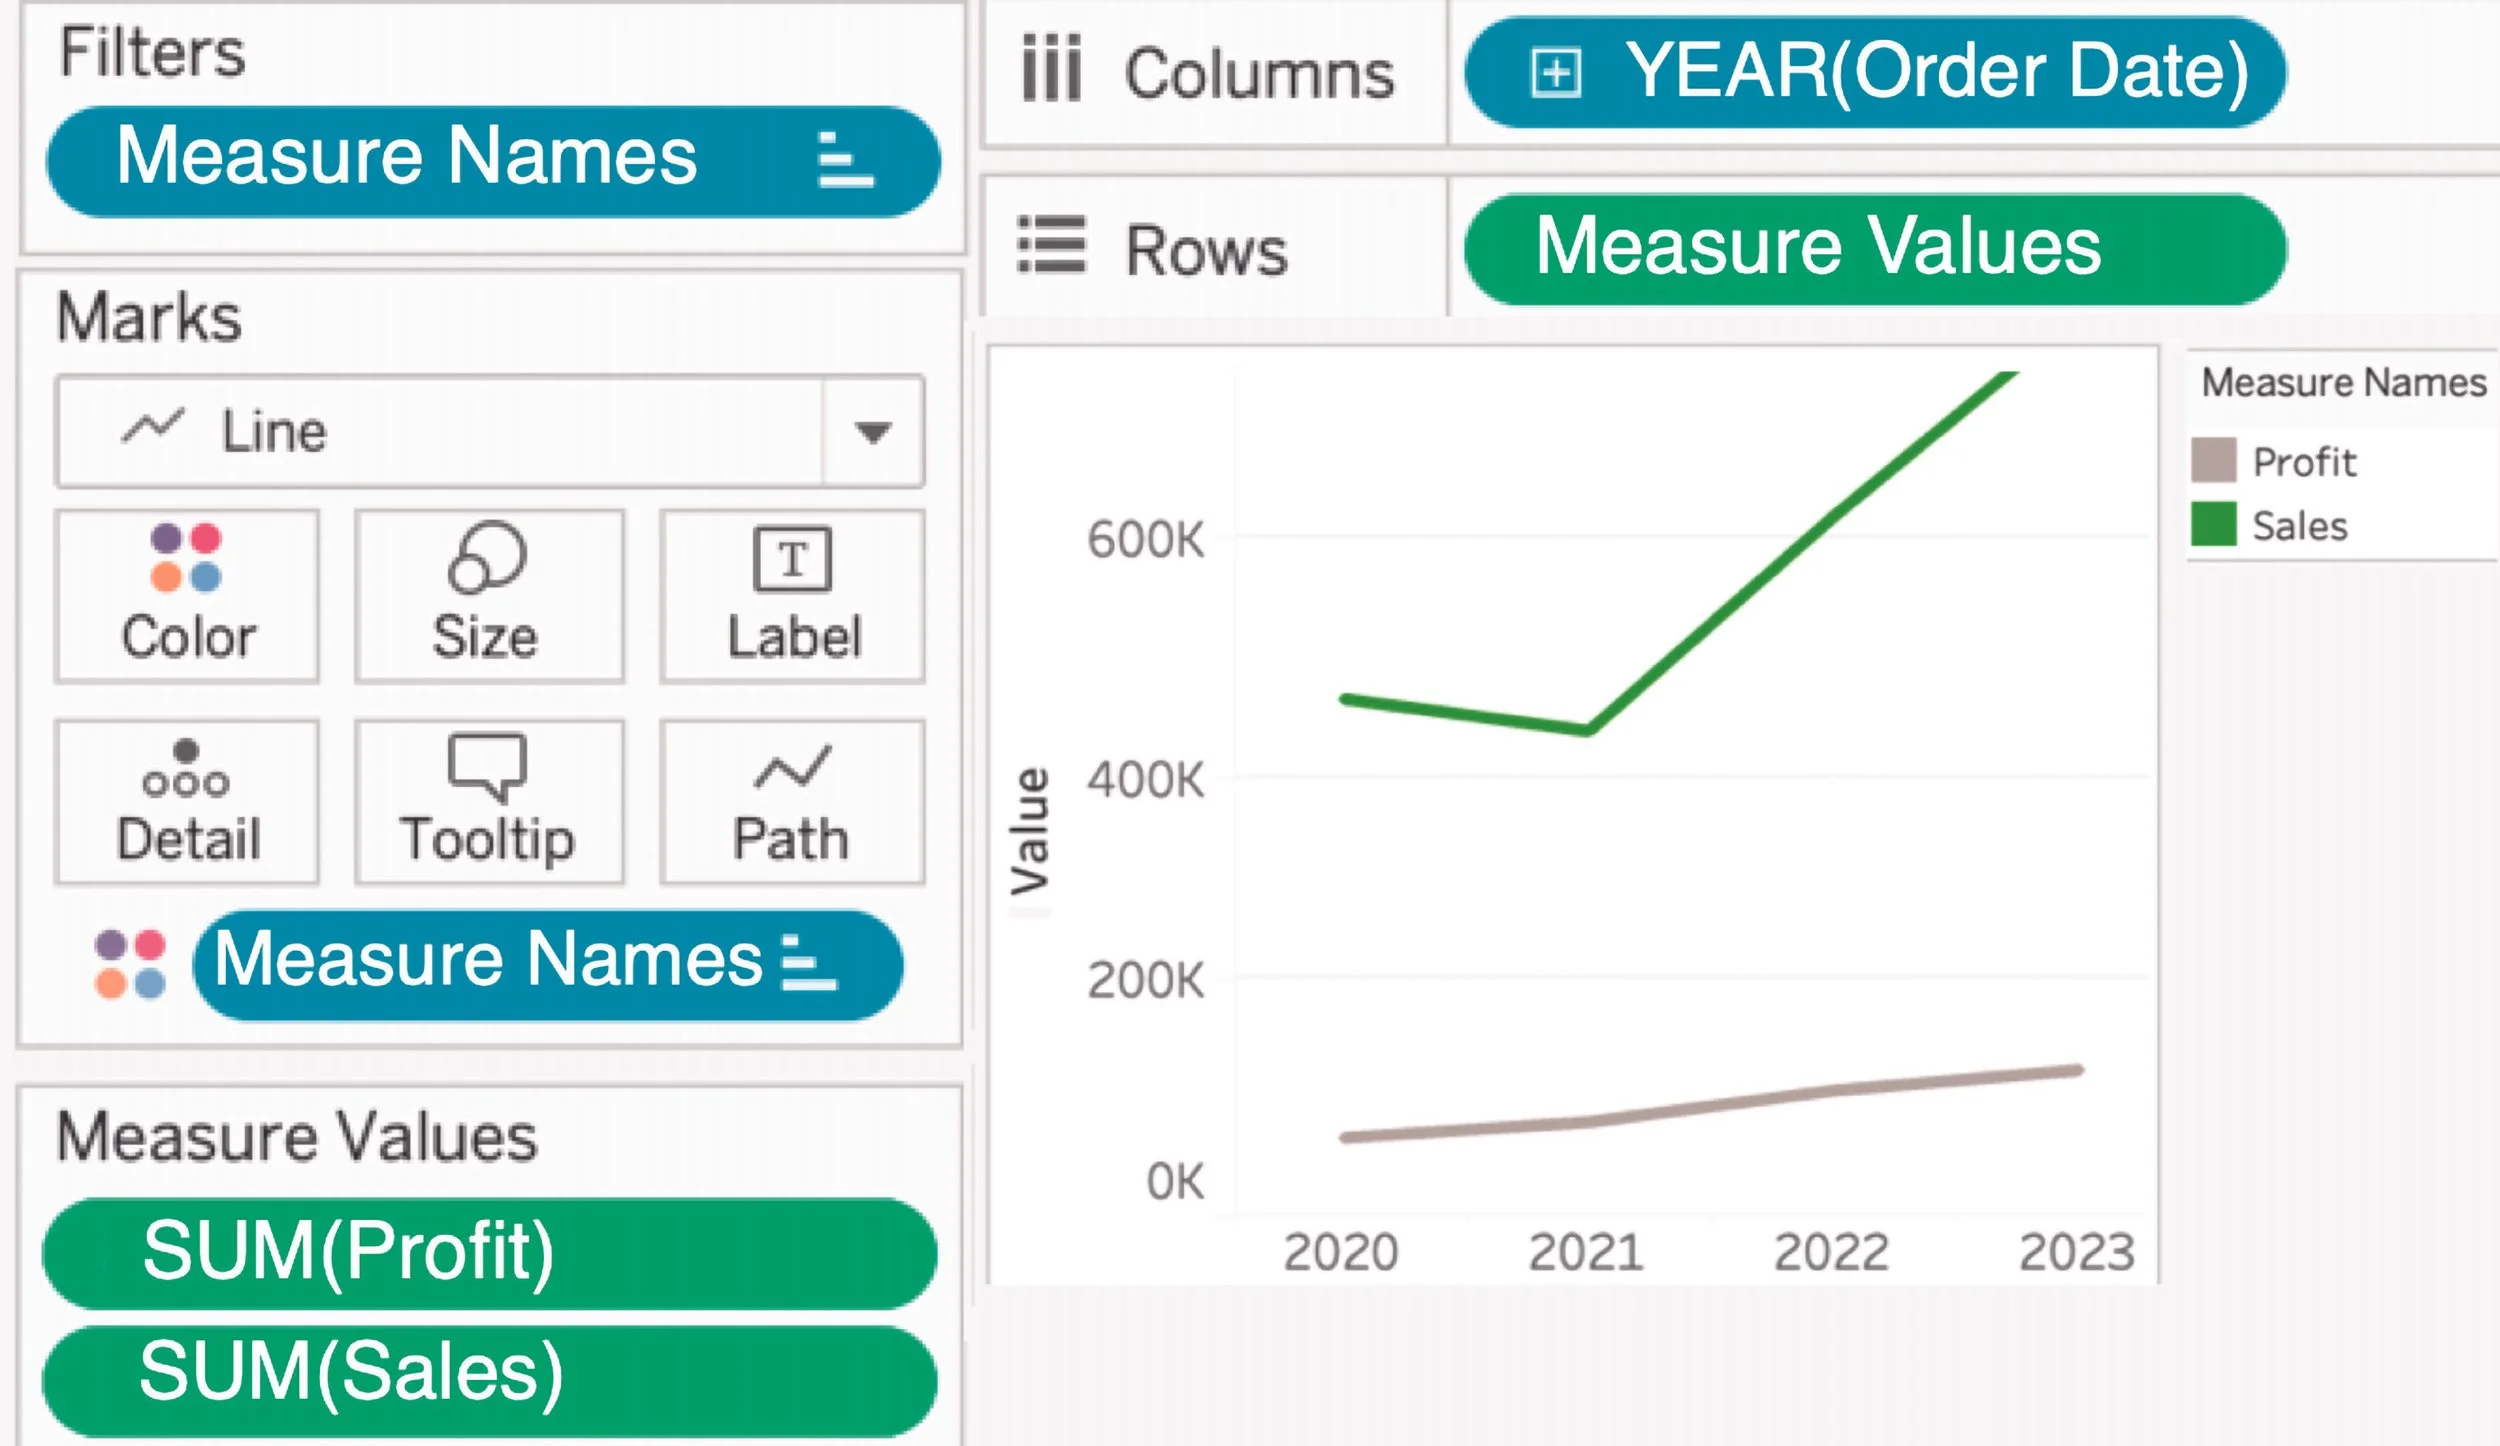
Line Charts, Blended Axes, Figure 6.2

Tree Map, Figure 7.68
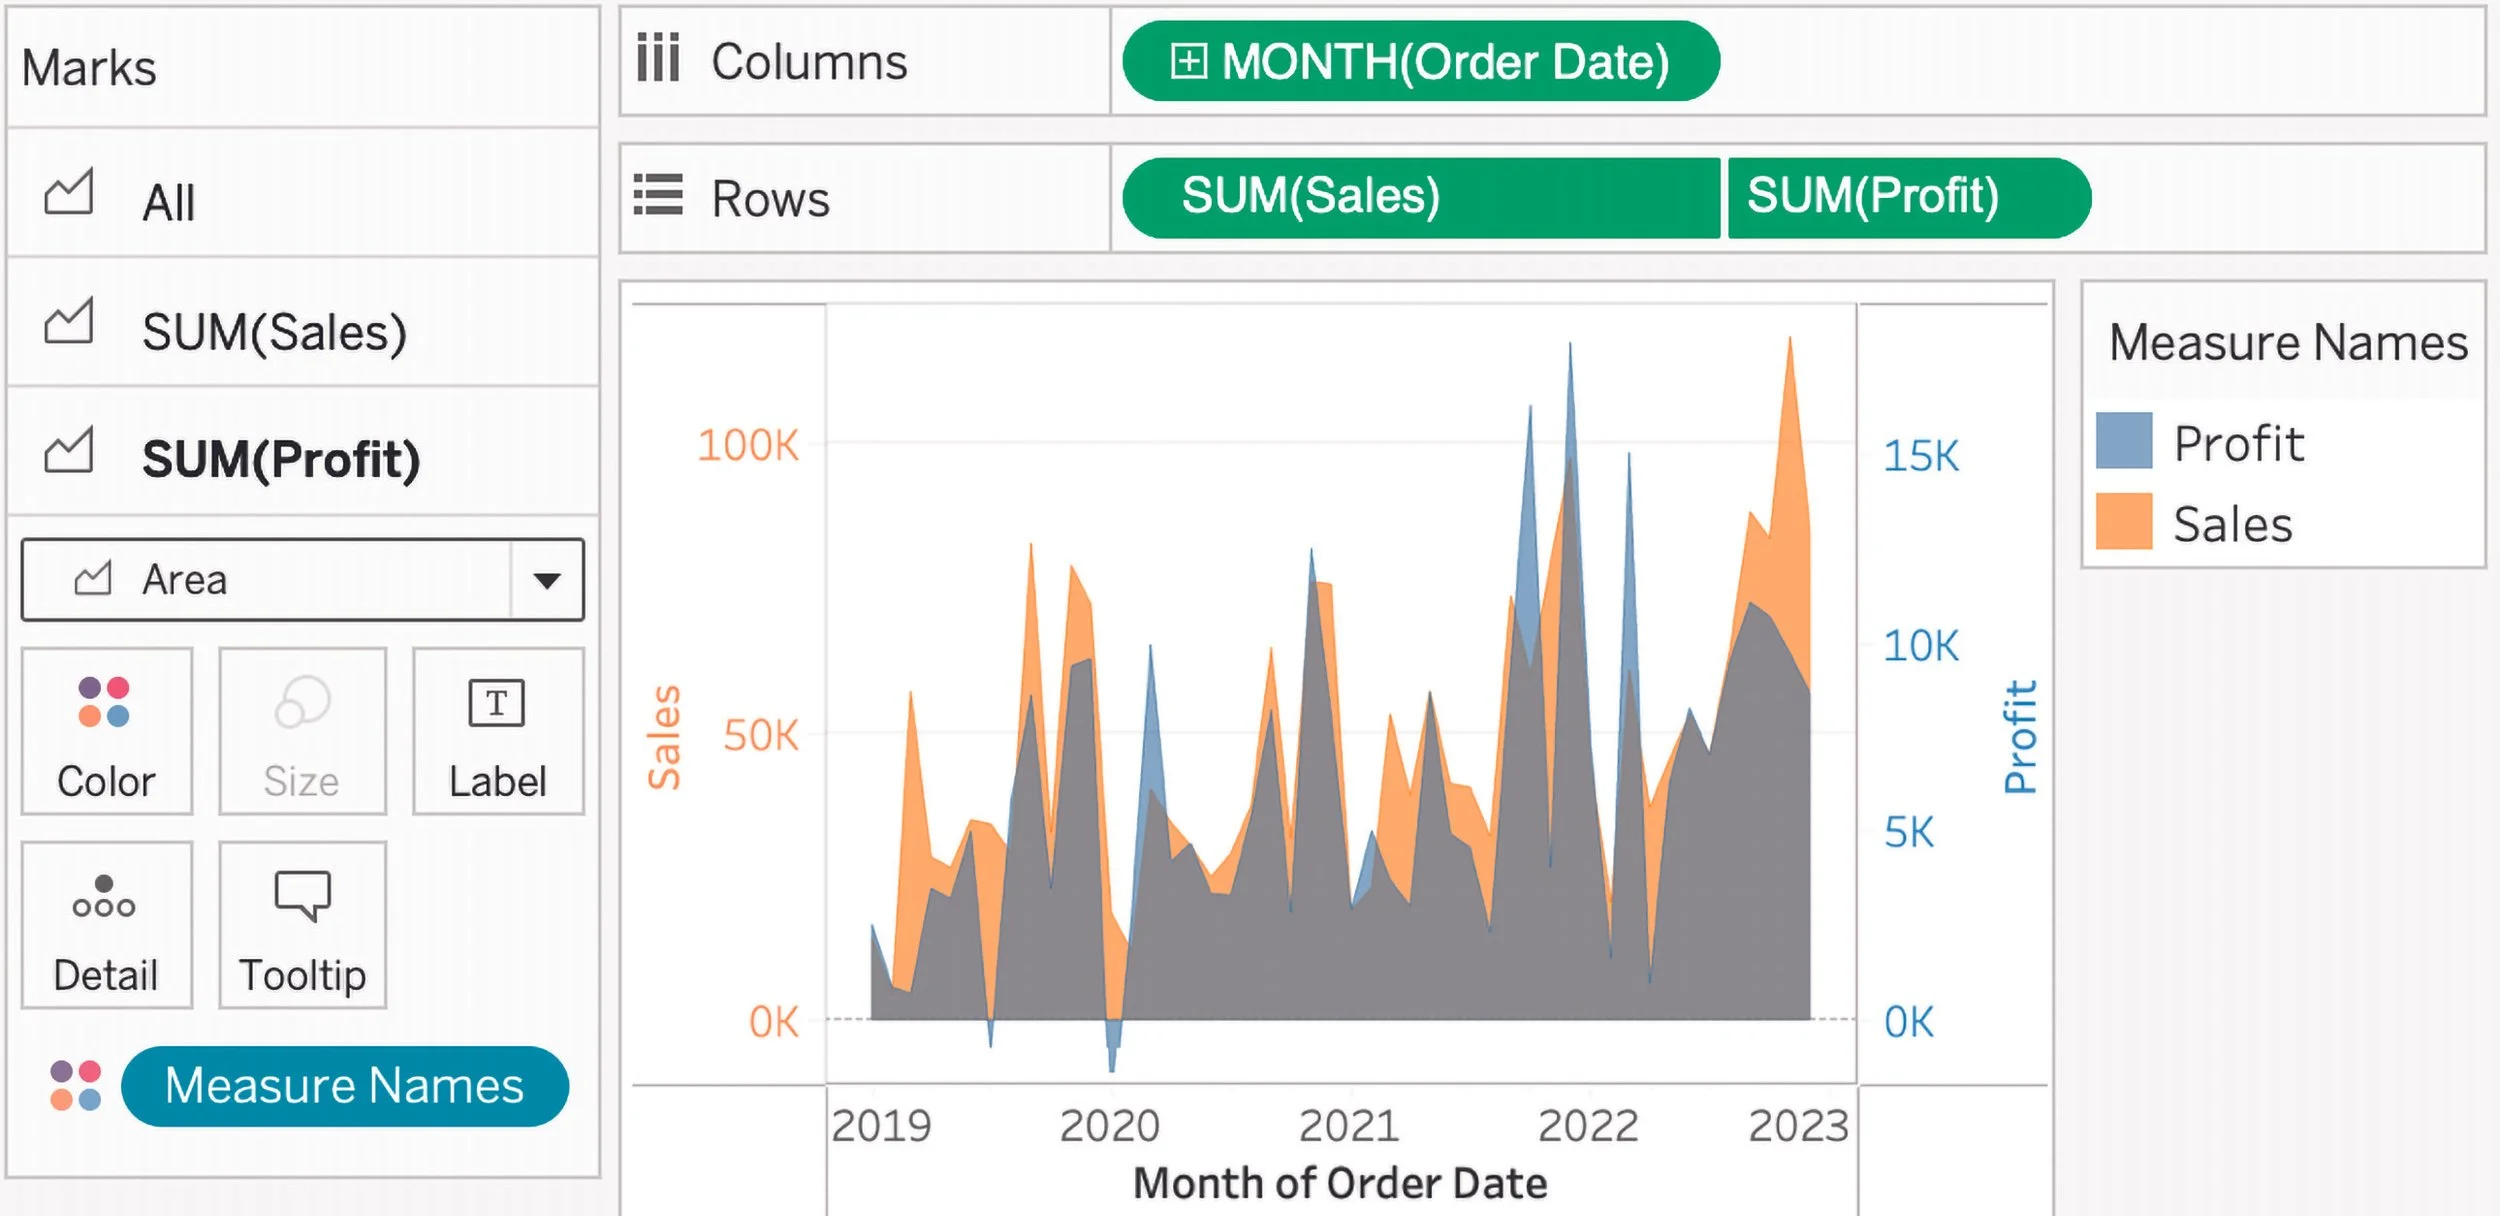
Dual Axes Chart: Area & Line, Figure 6.8

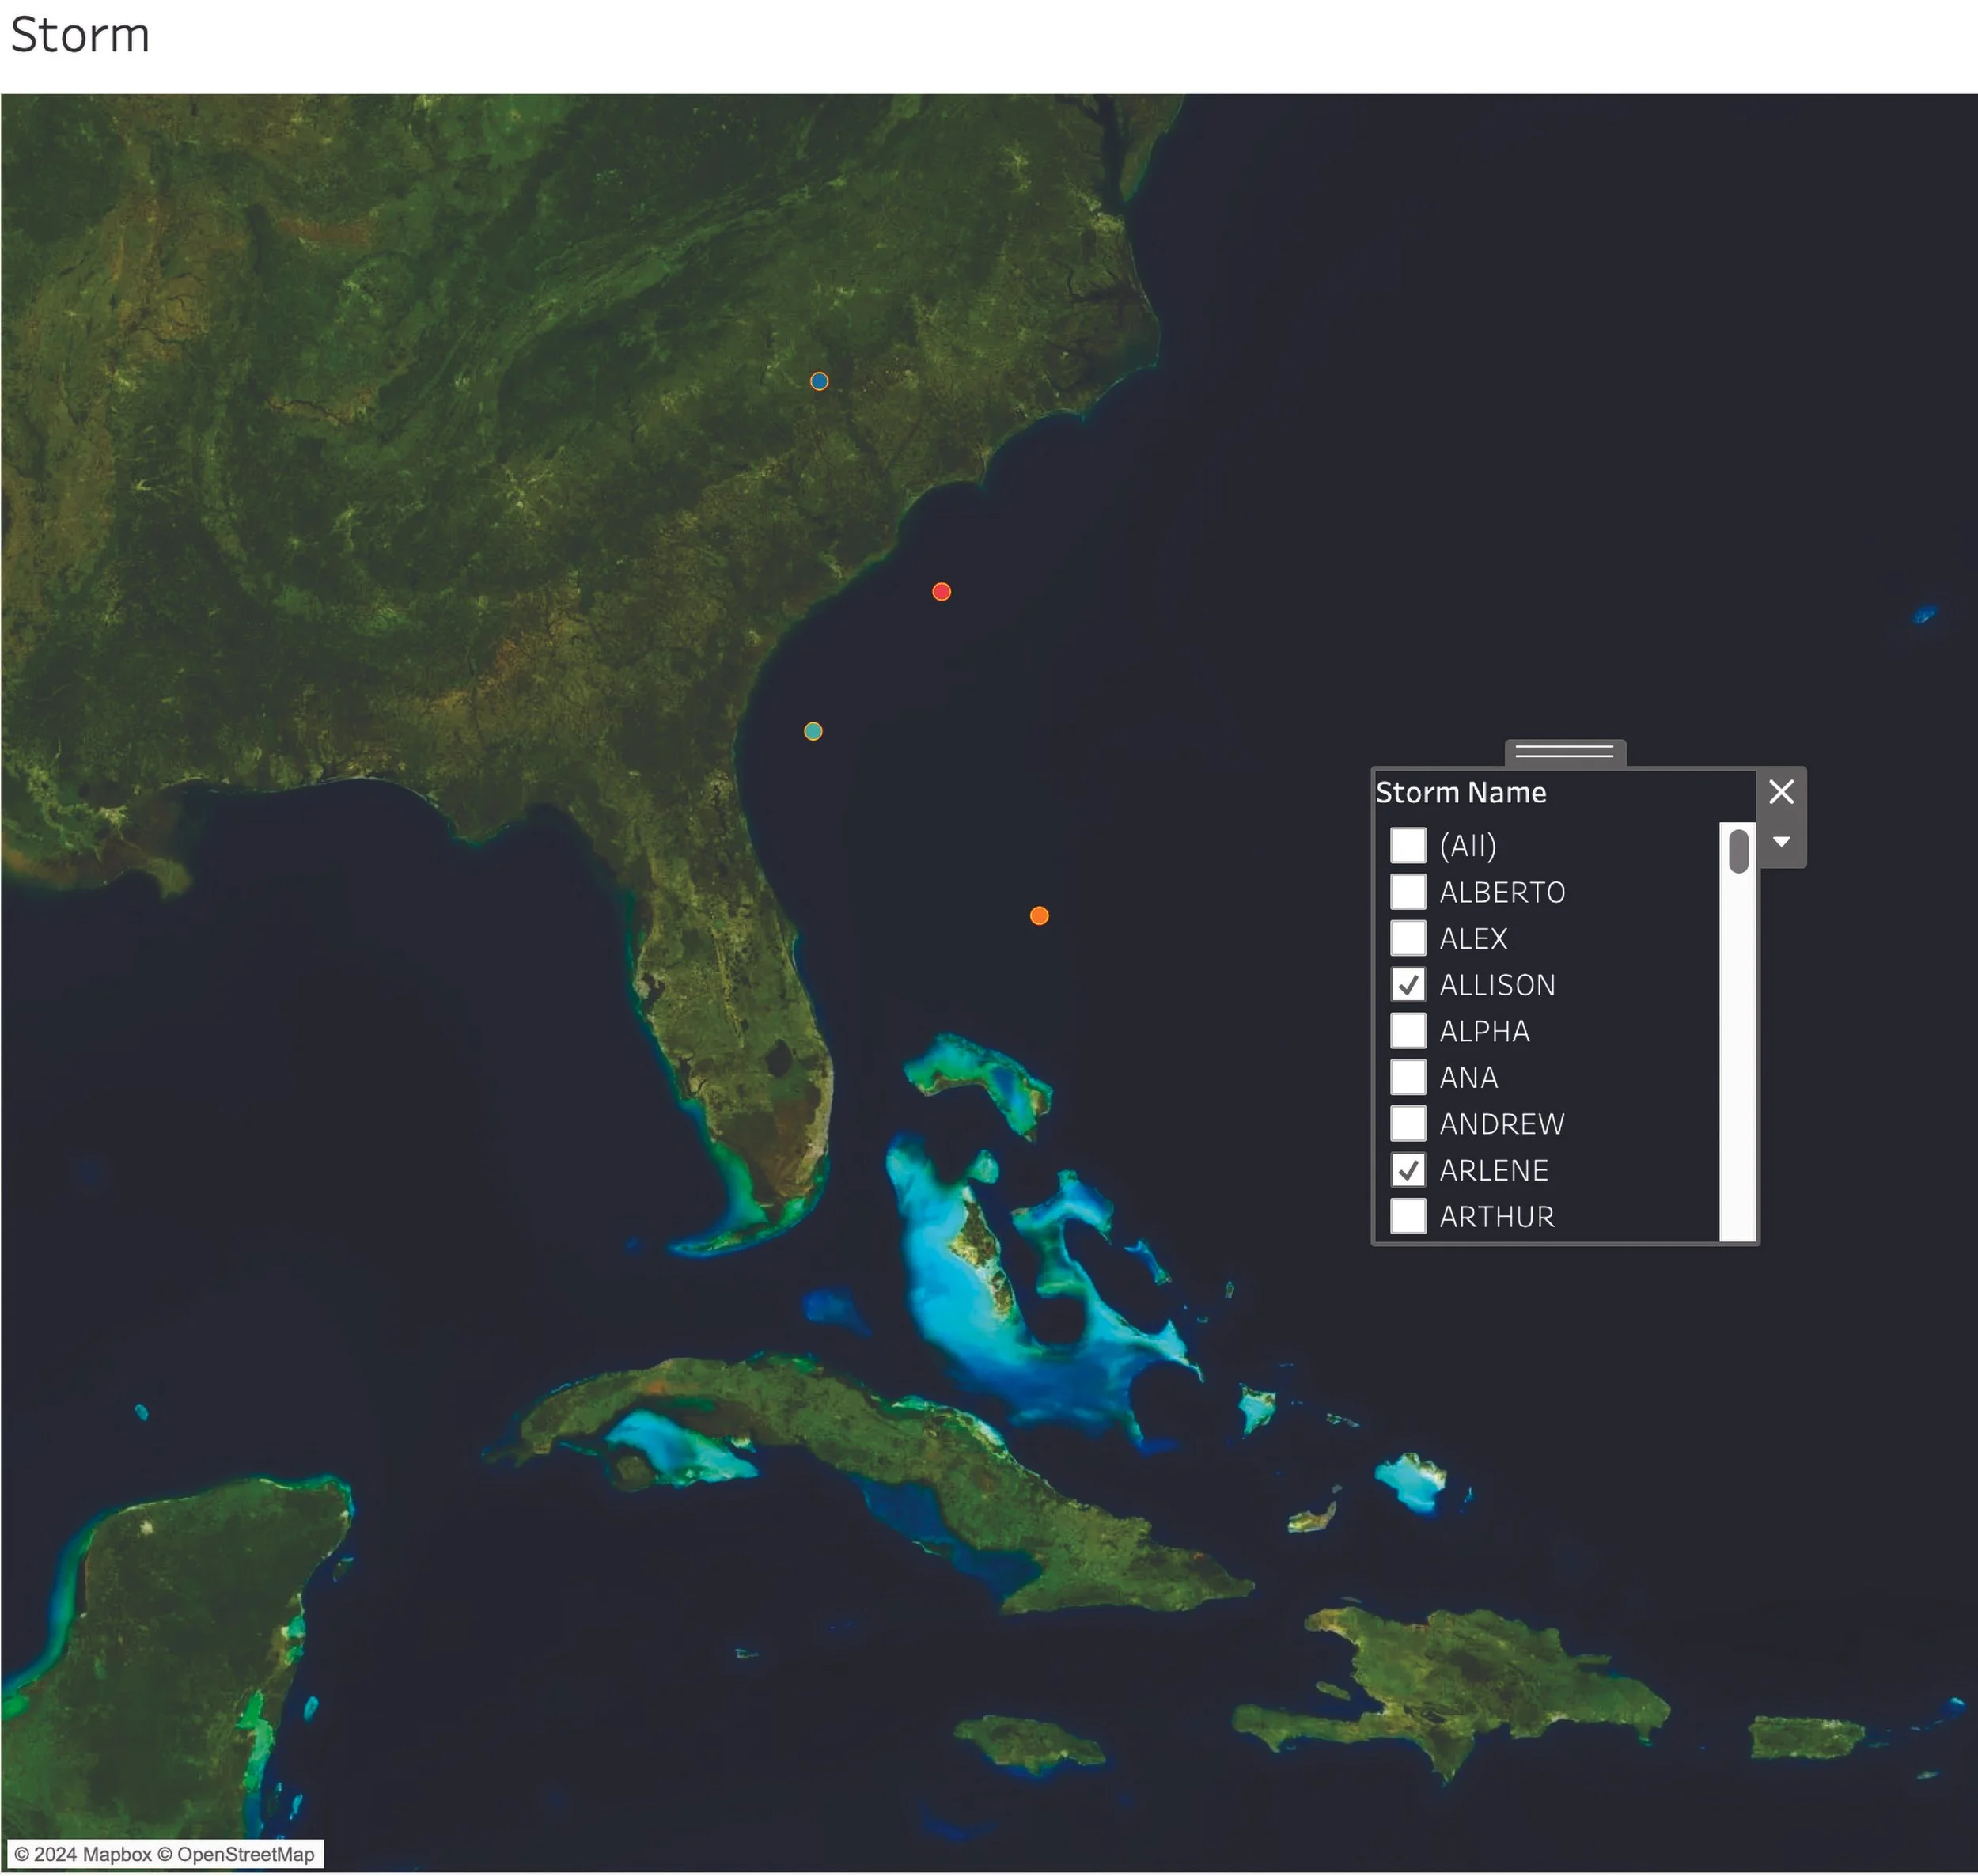
Maps, Show, Hide, & Format Legends, Figure 1.33

Maps, Halo, Figure 7.70
Formatting & Transparent Backgrounds, Figure 7.64
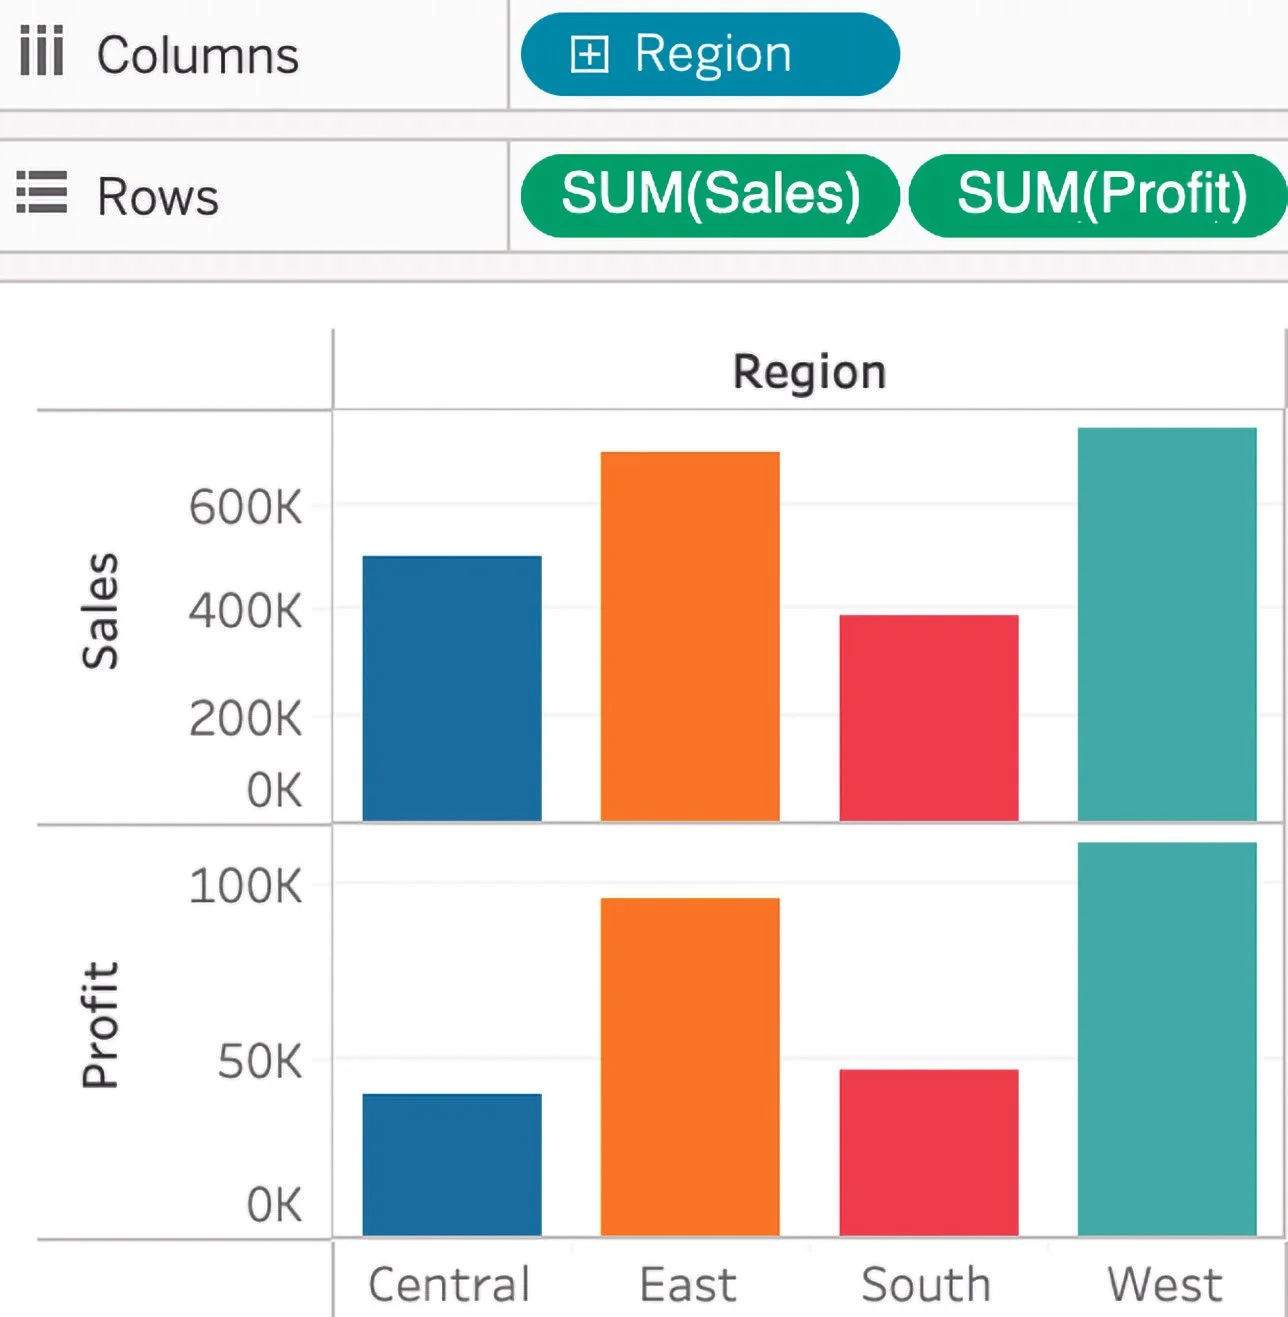
Multiple Charts in One View, Figure 6.10

Slope Chart with Rank, Figure 10.21

Filter the View, Not the Underlying Data, Figure 8.30

Color Positive & Negative Numbers, Figure 7.72

Positive & Negative Values, Switch Between Measures, Figure 15.42

Scatter Plot, Figure 7.59

Shape Chart, Arrows Comparing Two Values, Figure 12.64

Side-by-Side Circles, Figure 7.60

Stacked Bars, Figure 5.6

Text Table, Compute Using, Figure 10.26

Text Table - Weighted Average, Figure 11.54

Timeline Chart - Shape Marks, Figure 7.49

Time Duration Waterfall, Figure 9.30

Word Clouds with Circle Marks, Figure 7.31

Rounded End for Bar Charts, Figure 7.23

Sorting Segments Within a Stacked Bar, Figure 8.70
Call Attention to Marks with Invisible Shapes, Figure 7.50